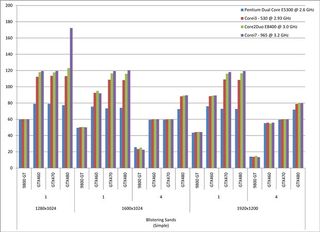
Most people do not find Excel sheets sexy. The reason for this is simple: Excel sheetsaren't sexy. However, if you happen to be that unique kind of person who spends hours updating drivers, overclocking your CPU, and adjusting the liquid cooling system of your monster gaming chassis, this particular chart is the kind of material we should keep behind the counter in a plastic wrapper. It’s an extensive series of StarCraft II benchmark tests conducted by graphics card maker Nvidia, and the more you know about PC performance, the more shocking these numbers are likely to seem to you.
Take a good look. Then scroll down and we’ll explain what we’re looking at and why we’re so riled up about it.
Above: Yeah baby. Right there
Basically, the brainiacs over at Nvidia wanted to see how various graphics card/CPU combinations performed running a medium-complexity StarCraft II replay.
Let’s look first at the left-most section. You’ll see “1280x1024” – that’s the resolution of the test. Then you’ll see a “1”. That means single-pass anti-aliasing was turned on.
And if you’ve ever visited a Best Buy or read an issue of Maximum PC, you’ll realize that last set of numbers, 9800 GT, GTGX480 and so on, are the model numbers of various nvidia graphics cards.
Finally, you’ll notice the same four colors reappearing over and over in the vertical bars. Each color corresponds to the performance of a specific CPU, as listed in the upper right corner of the chart. In fact, those colored bars are the key to this chart.
Sign up to the 12DOVE Newsletter
Weekly digests, tales from the communities you love, and more
Check out the very first column on the left – the 9800 GT. Notice anything strange? It delivers 60 frames per second – a very smooth performance threshold – using all four CPUs. That’s straight up bizarre.
Why? Because you can buy the blue line CPU for a mere $67onAmazonright now, but the purple one will run youmore than $650. For nearly 600 extra bones, shouldn’t you see a performance increase? You’d think so, but you don’t. At least, not to the degree you’d imagine.
This phenomenon – which really isn’t, as we’ll soon explain – is replicated across the entire chart. And it only gets more pronounced as you move into higher resolutions and 4x anti-aliasing (that’s the “4” that replaces the “1” in the third and fifth sections). The reason is apparently simple if you’re a programmer: StarCraft II developer Blizzard offloaded as much of the work as possible onto the graphics card, leaving the CPU load somewhat light. This was probably done to ensure the game would run, albeit less optimally, on as many low-end PCs as possible.
The bottom line? If you want to increase your StarCraft II performance, forget about upgrading your CPU. It almost doesn’t matter. But upgrading your video card could have a tremendous impact. That’s what makes this the chart that CPU makers like Intel and AMD don’t want you to see. It’s music to graphics card manufacturers' ears, obviously – and what a surprise, that’s who gave us the chart to begin with – but it’s hard to argue with the data.
That said, if you still really want to argue with the data, go for it. It’s a free country, and we’ve got a comment box below just waiting for you.
Aug 18, 2010
