Games as graphs (and charts!)
The visual display of quantitative information is much more fun than it sounds
2) Playing Games
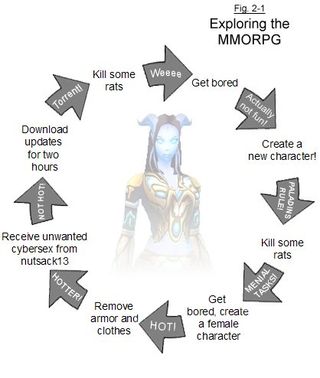
Figure 2-1. Exploring the MMO
Very little is known about the psychological phenomenon that causes the playing of, and subsequent addiction to MMOs, but the science is still in its infancy. In fact, researchers are still frantically deconstructing the spaceship that brought Ultima Online creator Lord British and his magical beard to our humble blue planet so many years ago.
The following chart (figure 2-1), leaked by a top secret government intern, lays out the approximate process of MMO consumption.

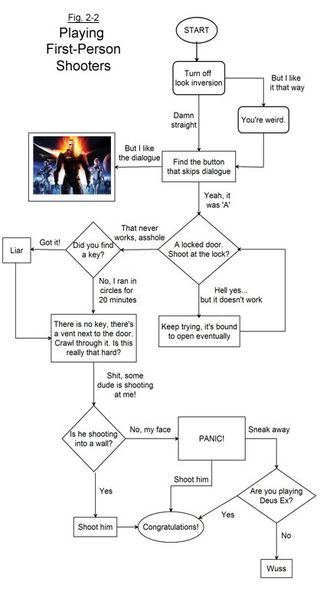
Figure 2-2. Playing First Person Shooters
Sure, FPSs seem easy to us, but that’s only because years of continuous finger twitching have dedicated a quarter of our motor skills to moving crosshairs around on screens and pressing switches that make elevators do shit. Ever watch a first-timer try to get through Half-Life 2?
“What’s going on? Where do I go? How do I shoot? Why are you taking your shirt off? I’m leaving.”
Sign up to the 12DOVE Newsletter
Weekly digests, tales from the communities you love, and more
LEARN IT IN A FLOWCHART!

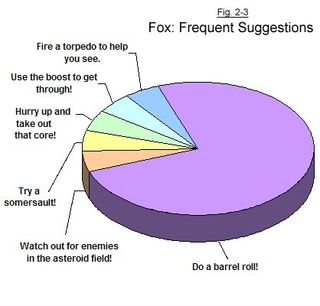
Figure 2-3. Prioritizing things you may or may not need to do

Call of Duty: Black Ops 6 Season 2 brings back a beloved game mode fans have been begging for, but all I care about is a practically meaningless bug fix
"Oryx is back": Destiny 2's final Episode takes the MMO to the site of the iconic Taken King expansion for a Coil-inspired roguelite mode, and also Star Wars armor
Most Popular

