Games as graphs (and charts!)
The visual display of quantitative information is much more fun than it sounds

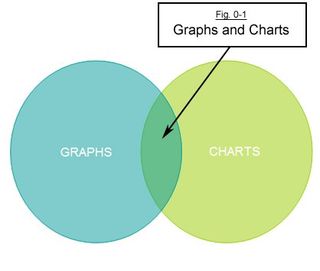
What’s that you say? Aren’t graphs and charts just for boring things like algebra and sexual positions?
Absolutely not! Videogames are best represented via the visual display of quantitative and sequential information, and we’ll prove it to you with the greatest, most graphical guide to gaming ever created. On to our first topic...
1) Game Identification
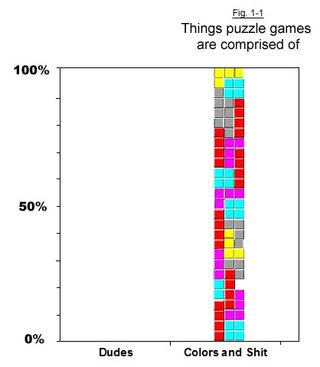
Figure 1-1. Puzzle Games
Puzzle games don’t generally contain any guns or swords. So how do you kill dudes, right? You don’t. They’re just about colors and shit. We know. Maybe it will be clearer in graph form:

Still not getting it – but at least we’d know one if we saw one. Remember; look for the colors and shit.
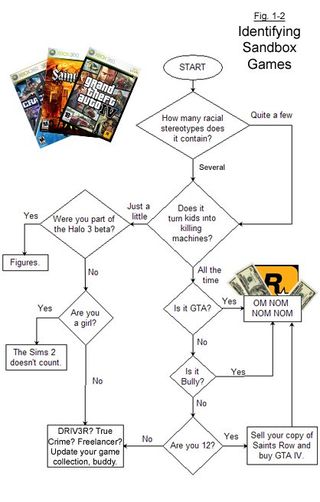
Figure 1-2. Identification of Sandbox Games
Sign up to the 12DOVE Newsletter
Weekly digests, tales from the communities you love, and more
If you want to understand the immensely popular sandbox genre, there’s no better way than to study a carefully constructed flowchart. Figure 1-2 will aid you in the identification of most sandbox crime games. Try it on your friends – it’s 123% accurate.

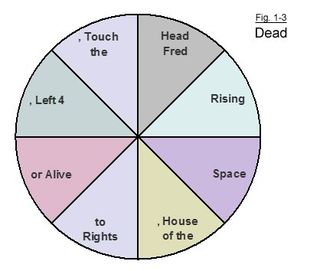
Figure 1-3. Prominence of “dead”
This chart is self-explanatory, which means that you should stop reading this and look at it.

Most Popular
